
What it costs to charge an electric car at home
The formula behind a home charge: energy drawn from the wall, charging losses, your rate and its off-peak hours, with a worked example you can redo yourself.
On this page
The short answer fits in one line: the energy your car draws from the wall, multiplied by the price you pay per kilowatt-hour. The details are where most estimates go wrong: the energy drawn from the wall is not the energy that ends up in the battery, and the price of a kilowatt-hour is rarely the same all day.
This guide gives you the formula, the traps, and a worked example you can redo with your own numbers.
The formula
Method
Cost of a charge = energy drawn from the wall (kWh) × your rate (per kWh)
Energy drawn from the wall = energy added to the battery ÷ charging efficiency
Two numbers are easy to confuse:
- Energy added to the battery: what the car shows at the end of a session, for example “+40 kWh”.
- Energy drawn from the wall: what your meter or your wall charger counts. It is always higher, because part of the energy is lost on the way.
Your electricity bill is based on the second one.
Where the missing kilowatt-hours go
When you charge at home on alternating current (AC), some energy never reaches the battery:
- the car’s onboard charger converts AC to direct current, and every conversion loses a little;
- cables, the wall charger and the battery heat up;
- the car stays awake during the whole session, so its computers, pumps and sometimes the battery heating or cooling run the entire time.
That last point explains why charging slowly is not always cheaper: at low power, the car stays awake longer for the same amount of energy, so its own consumption weighs more.
The most reliable way to know your losses is to measure them once:
Example
The car shows +40 kWh at the end of the session. Your wall charger or a separate meter shows 44 kWh drawn.
Losses: 44 − 40 = 4 kWh, that is 4 ÷ 44 ≈ 9% of what you paid for.
Charging efficiency: 40 ÷ 44 ≈ 0.91.
These figures are an example, not a typical value: losses depend on the car, the charging power, the temperature and your installation.
Your rate, hour by hour
A single price per kilowatt-hour is the easy case. Many home contracts are more detailed:
- peak and off-peak hours: a cheaper price at night or during set periods;
- seasons: winter and summer prices that differ;
- dynamic prices: a price that changes every hour, or even more often, depending on the market;
- fixed charges: the subscription or fixed monthly charge you pay whatever you consume. It is not part of the cost of one charge, but it matters when you compare contracts.
If your charge spans several periods, split it: energy drawn during off-peak hours × off-peak price, plus energy drawn during peak hours × peak price. Scheduling the charge so that it fits inside the cheapest window is often the simplest saving.
A worked example
Example
Energy added to the battery: 40 kWh. Charging efficiency measured above: 0.91.
Energy drawn from the wall: 40 ÷ 0.91 ≈ 44 kWh.
Rate: 0.18 per kWh during off-peak hours, with the whole charge inside that window.
Cost of the charge: 44 × 0.18 ≈ 7.92.
Replace each value with your own: the energy shown by your car, your measured efficiency, and the price printed on your contract. The currency does not change the method.
From the cost of a charge to the cost per 100 km
To compare with a gas car, or with your own habits from one season to another, the useful figure is the cost per distance:
Method
Cost per 100 km = consumption from the wall (kWh/100 km) × rate (per kWh)
Consumption from the wall is the consumption shown by the car divided by the charging efficiency. Our guide to understanding your car’s consumption explains what makes it vary.
Fast chargers and public charging
Public charging follows other rules: a price per kilowatt-hour, sometimes per minute, sometimes with a session fee, an idle fee or a subscription that lowers the price. The price can also depend on the time of day. For these sessions, the receipt from the network is the reference: it already includes everything you paid. For Tesla Superchargers, our guide to the cost of charging a Tesla covers prices, fees and invoices.
What Voltessa does
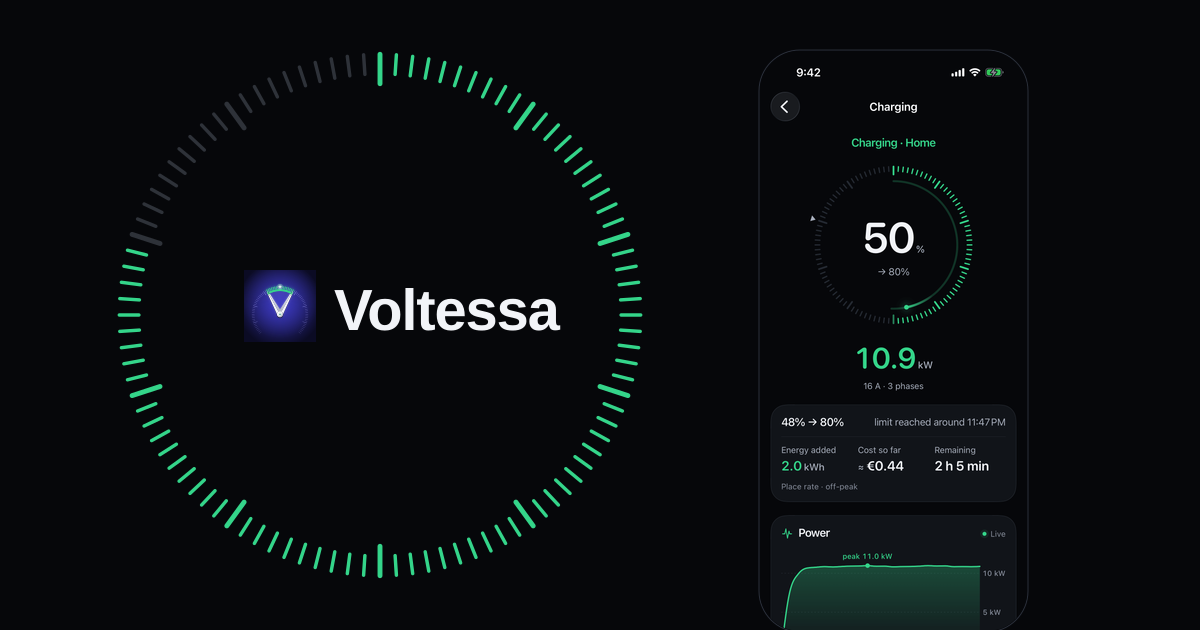
Voltessa records every charging session with the energy added and its power curve, at home and elsewhere. You enter your home rates once, with their peak and off-peak hours and their seasons, and your fast-charging rates if you like. Voltessa then calculates the cost of each session and of each trip, in your currency.
That cost is an estimate built from the energy your car reports and the rate you set for that place, and it is marked as such in the app. If a session does not match your bill, you can correct its cost by hand. Your electricity bill and the network receipts remain the reference.
Voltessa works with Tesla vehicles, on iPhone, iPad, Mac and Apple Watch.
Related articles
How much does it cost to charge a Tesla?
What a Tesla charge really costs at home and at a Supercharger: the formula, charging losses, off-peak hours, Supercharger prices and fees, and the invoice.
Checking your Tesla's battery health
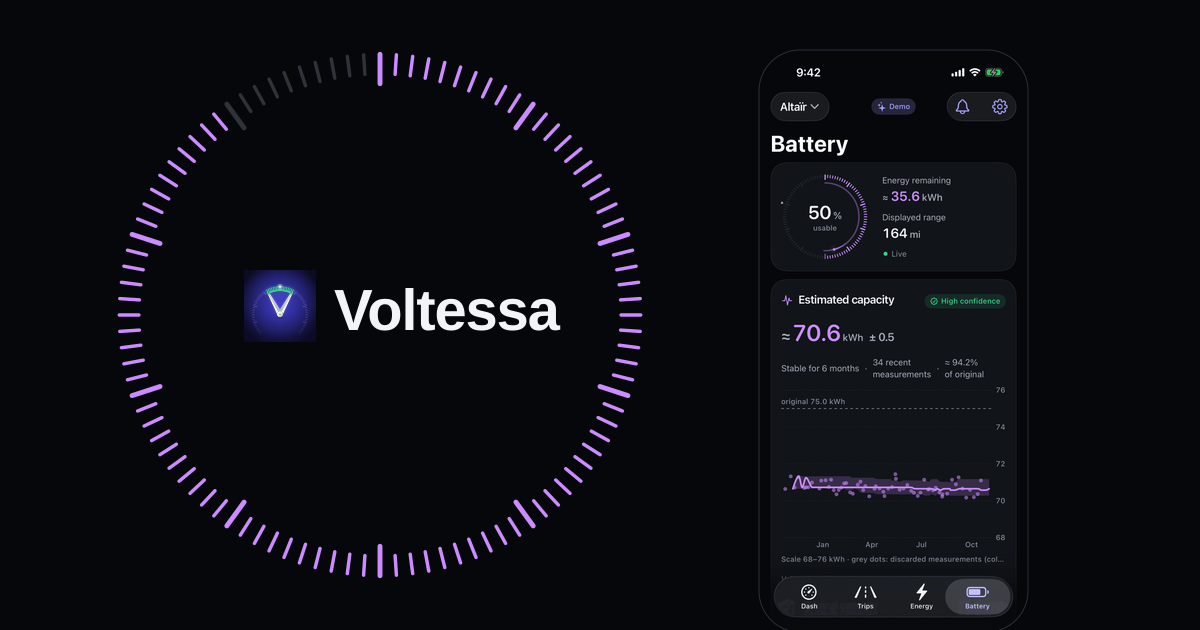
The car's own Battery Health screen and test, a certified report, or your charging data: three ways to check a Tesla battery, normal loss and the warranty.
Your Tesla's real-world consumption and the Energy app
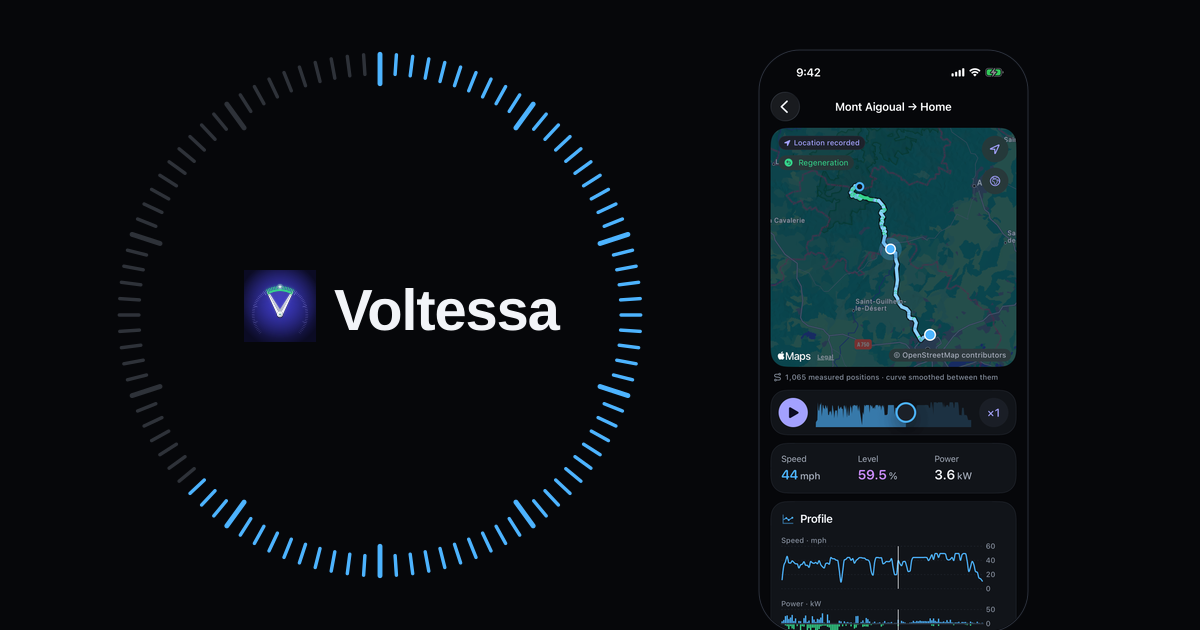
Where your Tesla shows its consumption in Wh/mi or Wh/km, why the range on screen differs, and what makes it vary: speed, cold, short trips, climate.